MARKET RECAP

WEEK OF FEBRUARY 09, 2026

A retired woman enjoys a day biking at the beach, confident that her financial strategy means she won't outlast her money.

The reemergence of the 'Sell America' trade.

 Hello ,

Despite headlines hinting at fading demand for US assets, the idea of a broad 'Sell America' trend is overstated. While renewed tariff threats and strains in the transatlantic alliance have added fresh volatility, these appear to be short-term noise rather than signs of a structural shift. Market behavior after the April 2025 tariff tantrum points to resilience, not retreat. The latest Treasury International Capital (TIC) data shows that foreign holdings of US equities remain on track to rise $2.8t in 2025 and foreign ownership of Treasuries has climbed to a record $9.4 trillion in November. Treasury auctions also continue to show healthy demand from US and foreign buyers. Taken together, the data reinforces our view that concerns about a sweeping 'Sell America' trade are greatly exaggerated.


Highlights:

  • Consumer confidence plunged in January to 84.5—the lowest since May 2014—with both the Present Situation and Expectations Indexes dropping sharply. Concerns about inflation and weak job prospects were cited across all demographics.

  • US trade deficit widened sharply in November, doubling to $56.8b from $29.2b in October. The rebound reflects normalization after October’s unusually low deficit and has pushed the Atlanta Fed GDPNow estimate for 4Q down from 5.4% to 4.2% QoQ, annualized.

  • The PPI for final demand came in stronger than expected at 0.5% MoM—its highest monthly increase since last September—and climbed 3.0% YoY. Trade services were the major driver of December’s gain, growing 1.7%

  • Focus of the Week: Next week, attention will turn to the labor market. The week begins with the Job Openings and Labor Turnover Survey on Tuesday, followed by jobless claims and unit labor costs on Thursday. Friday brings the all-important January employment report, and we expect the monthly increase in nonfarm payrolls to rise to 70,000 (from 50,000 last month). Friday will also feature updated payroll guidance from the Bureau of Labor Statistics, along with revised employment estimates for 2025.

The risk of a prolonged government shutdown has lessened, with the White House and Senate Democrats striking a deal on Thursday. Senate Democrats had threatened to withhold support of the final six-bill funding package given its inclusion of DHS (and ICE) funding ahead of the deadline on Friday, January 30. Following a failed procedural vote (which eight Senate Republicans joined in defeating), the White House and Senate Democrats reached an agreement to carve out DHS funding from the package. The deal would see the other five bills advance, and a 2-week CR provided for DHS to allow for further negotiations on ICE reform. The package will still need approval from both the House and Senate. With the House in recess until Monday, we could see a short government shutdown over the weekend; however, we view the pressure from Trump as a positive for House passage.

The S&P 500 is roughly flat week-to-date as positive remarks from Chair Powell acknowledging some signs of labor market stabilization were offset by mixed reactions to 4Q25 earnings,particularly within the Technology sector. In fact, software has declined by 12% YTD and is now the worst-performing S&P 500 industry as monetization of AI within software specifically has fallen short of elevated market expectations. However, fundamentals within theindustry remain robust. Given the recent sell-off, relative valuations for the industry are now at the lowest level vs. the S&P 500 since 2015, and EPS growth within the space is expected to outpace theS&P 500 for full-year 2026. Therefore, we see opportunities within the software industry overall, although selectivity remains critical.

After three straight rate cuts, the Fed held its policy rate at 3.50%–3.75%—a range officials view as within estimates of neutral—citing reduced risks around both inflation and the labor market. The decision drew broader support than December’s rate cut, though Gov. Miran and Waller dissented, favoring further easing. At his press conference, Chair Powell sidestepped questions about recent political criticism, instead emphasizing the economy’s resilience and reiterating expectations that tariff-related inflation will peak in Q2 or Q3. While policy remains on hold, he stressed that no one on the committee views a rate hike as the next move. For markets, it was a non-event—consensus expected the Fed to remain on hold for several meetings before delivering two cuts by year-end.

This was another record-breaking week in gold (up 18% YTD), silver (up 40%), and platinum (up 10%). As we noted on Monday, we encourage investors not to get carried away by the momentum. Gold's long-standing popularity in times of global turbulence has a flip side: when geopolitical risks subside, investor appetite for gold may also diminish. A durable Russia-Ukraine ceasefire, as well as a diplomatic resolution to US-EU tensions over Greenland, are two plausible scenarios for the next 6 to 12 months that could reduce gold’s appeal. We cannot offer a price target for gold because this market is too dependent on investor sentiment.


Warm regards,

Market YTD

Region Weekly YTD
S&P 500 0.8% 1.9%
Russel MidCap –0.9% 4.0%
Russell 2000 –2.3% 7.0%
AC World 1.4% 3.6%
Emerging Markets 4.0% 10.8%
US Aggregate Bond 0.2% 0.2%
BG Commodity 5.8% 13.6%
US Dollar –2.1% –2.1%

Market roundup

Does the dollar’s decline and gold’s rally signal rising debasement anxiety?

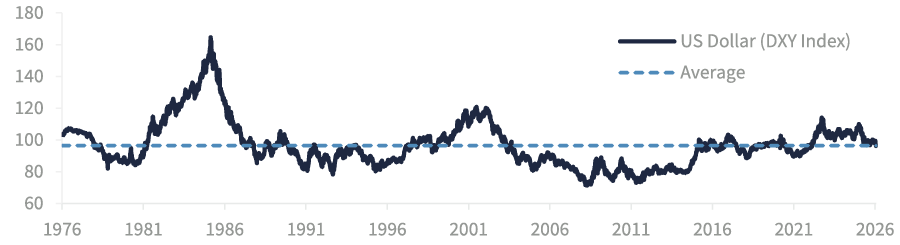
Calls for the demise of the US dollar are nothing new. Dollar bears often point to its declining share of global reserves—now at ~57%, down from ~64% in 2017—and tie this to rising policy unpredictability. Yes, the dollar slipped ~9% last year and is down ~2% year-to-date amid renewed uncertainty, but context matters. First, despite recurring headlines, the dollar’s share of global reserves has been remarkably steady, with Federal Reserve data showing no meaningful shift away from the dollar after the 2022 Russia sanctions. Second, claims that gold has 'replaced' the dollar as the preferred reserve asset are overstated: gold’s rising share largely reflects its 200%+ price gain since 2019, not broad reserve reallocations. Third, the US dollar remains the dominant currency in global transactions—accounting for just over 50% of all SWIFT flows—underscoring its central role in global finance. While its market value can move in the short run, history shows the dollar has been remarkably stable, trading near the midpoint of its 50-year range. After an unusually strong period of performance, it is simply returning to pre-COVID levels. We expect the dollar to remain broadly stable in 2026.


Depressed confidence signals softer spending ahead

In recent years, consumers have essentially been saying one thing and doing another. Confidence has been depressed—sitting below its 30-year average for 11 straight months—yet spending has remained strong, running above 5% YoY the entire time. The latest drop in confidence and the low 3.5% savings rate (its weakest since October 2022) raise understandable concerns, but we still don’t expect a meaningful pullback in spending. Why? First, while the labor market has been soft, we expect hiring to improve in 2026 relative to 2025, giving households more income support. Second, tax-bill changes should lift the average refund by roughly $1k, and rising equity markets have boosted household net worth—offering a one-time lift to spending. And finally, major events such as the World Cup should help fuel tourism-related demand. Together, these dynamics support our decision to upgrade the Consumer Discretionary sector heading into the year.


Tech-related leadership has come to an end?

The Tech sector has gotten off to a weak start to the year (-0.3%), but the story beneath the surface is anything but uniform: semiconductors are up 8% while software is down 12%. Even with this dispersion, 4Q25 earnings across tech-related names have been strong, with management teams repeatedly noting that AI-chip demand continues to outpace supply—supporting a robust outlook for AI capex and infrastructure in the year ahead. That said, post-earnings reactions show investors are becoming more discerning, rewarding companies that balance future growth investment with margin discipline and free-cash-flow strength. Overall, we remain overweight the Tech space. Why? Superior earnings growth—nearly double the broader market—along with sustained AI investment and valuations at their lowest level vs. the S&P 500 since 2015 continue to support the group. But selectivity will be essential.

Chart of the week

A long-term perspective on the US dollar.

The US dollar has historically moved through multi-year cycles of strength and weakness. Following its recent pullback, the dollar is now sitting close to the mid-point of its 50-year trading range.

Disclosures: Investing involves risk, and investors may incur a profit or a loss. All expressions of opinion reflect the judgment of the Raymond James Chief Investment Officer and are subject to change. There is no assurance the trends mentioned will continue or that the forecasts discussed will be realized. Past performance may not be indicative of future results. Economic and market conditions are subject to change. Diversification does not guarantee a profit nor protect against loss.


The Dow Jones Industrial Average is an unmanaged index of 30 widely held stocks. The NASDAQ Composite Index is an unmanaged index of all common stocks listed on the NASDAQ National Stock Market. The S&P 500 is an unmanaged index of 500 widely held stocks. The MSCI EAFE (Europe, Australasia and Far East) index is an unmanaged index that is generally considered representative of the international stock market. The Russell 2000 is an unmanaged index of small-cap securities. The Bloomberg Barclays US Aggregate Bond Index is a broad-based flagship benchmark that measures the investment grade, US dollar-denominated, fixed-rate taxable bond market. An investment cannot be made in these indexes. The performance mentioned does not include fees and charges, which would reduce an investor’s returns.


Companies engaged in business related to a specific sector are subject to fierce competition and their products and services may be subject to rapid obsolescence. There are additional risks associated with investing in an individual sector, including limited diversification. A credit rating of a security is not a recommendation to buy, sell or hold the security and may be subject to review, revision, suspension, reduction or withdrawal at any time by the assigning Rating Agency. Bond prices and yields are subject to change based upon market conditions and availability. If bonds are sold prior to maturity, you may receive more or less than your initial investment. Income from municipal bonds is not subject to federal income taxation; however, it may be subject to state and local taxes and, for certain investors, to the alternative minimum tax. Income from taxable municipal bonds is subject to federal income taxation, and it may be subject to state and local taxes.


Investing in commodities is generally considered speculative because of the significant potential for investment loss. Their markets are likely to be volatile and there may be sharp price fluctuations even during periods when prices overall are rising. International investing involves special risks, including currency fluctuations, differing financial accounting standards, and possible political and economic volatility. The Consumer Price Index is a measure of inflation compiled by the US Bureau of Labor Studies. The Leading Economic Index (LEI) provides an early indication of significant turning points in the business cycle and where the economy is heading in the near term.


Investing in small-cap stocks generally involves greater risks, and therefore, may not be appropriate for every investor. The prices of small company stocks may be subject to more volatility than those of large company stocks. The ISM Services Index is an economic index based on surveys of more than 400 non-manufacturing (or services) firms' purchasing and supply executives. The ISM Manufacturing Index, also known as the purchasing managers' index (PMI), is a monthly indicator of U.S. economic activity based on a survey of purchasing managers at more than 300 manufacturing firms. Material created by Raymond James for use by its advisors.


Privacy policy


Disclosure


  Check the background of this firm on FINRA's BrokerCheck.


You are receiving this email because you opted in via our website or are a valued customer. 


Our mailing address is:

Lang Investment Services

236 N Washington St

Monument, CO 80132-8289

Your referrals mean everything.

If you know of friends or family who could benefit from the financial products we offer at Lang Investment Services, please forward this email or have them contact us at (719) 481-0887.


Click here to leave us a review on Google.

Follow Lang Investment Services on social media.

 Copyright © 2026 All rights reserved.


To change how we communicate with you, visit your

or click to be removed from all.